A Visibility report shows how often your brand appears in AI answers for one topic, how that presence trends over time, how it compares to competitors, and which sources feed those answers. It reads the AI responses your prompts generate; it does not write or publish content. The figures here describe presence and citations, not sentiment or accuracy — those live in their own reports.
What do you need first?
- A domain with at least one topic.
- Your prompts have already produced answers for that topic, so the report has responses to analyze.
- The Visibility report open for your chosen topic.
Step 1: Read your Visibility Score
Open the report and start at the top-left block. The headline percentage is your Visibility Score for this topic, followed by a ranked list of brands and their individual scores.
The ranked list shows where you stand against named competitors, and a footnote states how many answers the score draws from. On the right, the Score Evolution chart plots each brand's score across the selected time range.
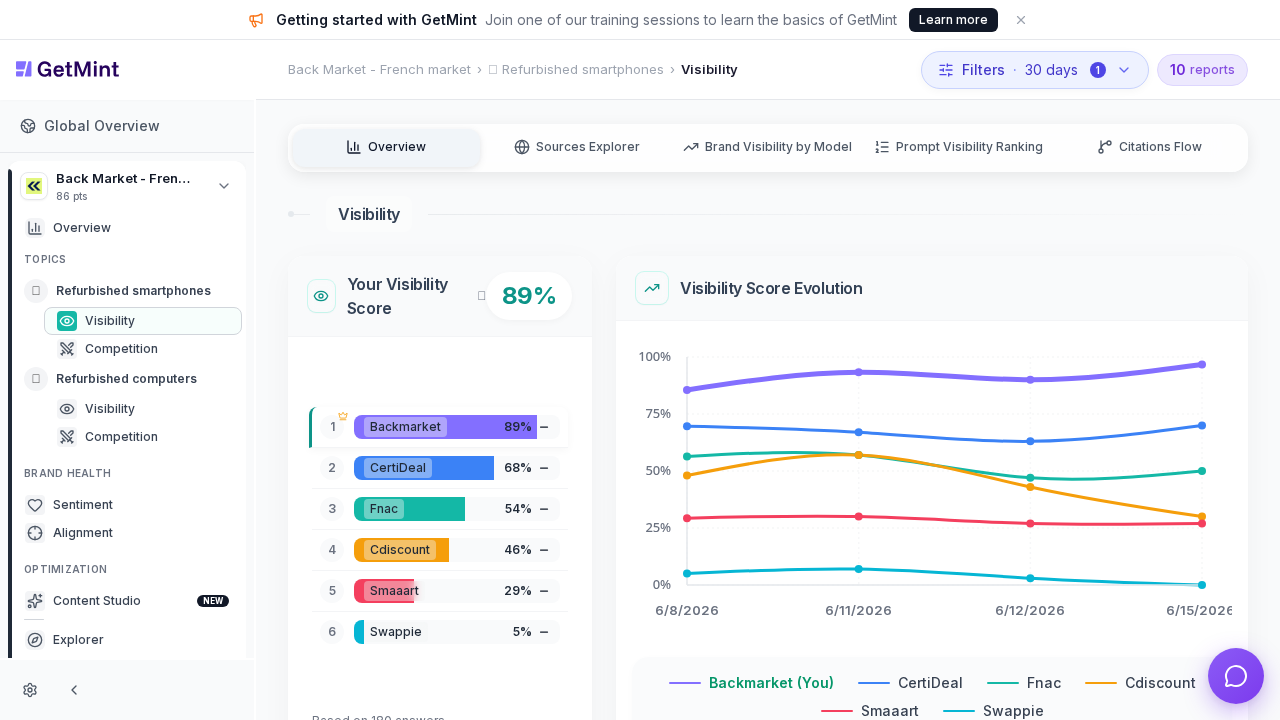
The Visibility report: your Visibility Score and brand ranking on the left, Score Evolution trend on the right.
Your Visibility Score is the share of analyzed answers in which your brand appears. In this example Backmarket leads at 89%, ahead of CertiDeal at 68% and Fnac at 54%, based on 180 answers.
💡 Tip: Use the time filter (set to 30 days here) to widen or narrow the window. The score and every block below recalculate for the range you pick.
Step 2: Read the Score Evolution trend
Move to the Score Evolution chart on the right. Each colored line is one brand, with your brand highlighted in the legend, plotted against dates on the horizontal axis.
The trend tells you whether your presence is rising, holding, or slipping over the selected period. A line climbing toward 100% means your brand appears in more answers over time; a falling line means fewer. Compare the slope of your line against competitors to see who is gaining ground.
Step 3: Read Share of Voice
Scroll to the Share of Voice block. Unlike the score — which counts whether a brand appears at all — Share of Voice counts total mentions and turns them into a percentage of all brand mentions for the topic.
The ranked list shows each brand's share and raw mention count, and a Brands Distribution breakdown groups the leaders against an "Others" bucket.
Share of Voice measures how much of the conversation your brand owns, not just whether it shows up. Backmarket holds 7.5% with 160 mentions, ahead of CertiDeal at 5.7% (122 mentions), while "Others" accounts for 74.6%.
📌 Note: A brand can rank high on Visibility Score yet hold a smaller Share of Voice — appearing in many answers but being mentioned fewer times within each one. Read both together.
Here is how the two presence metrics differ:
| Metric | What it counts | Reads as |
|---|---|---|
| Visibility Score | Whether your brand appears in an answer | % of answers featuring you |
| Share of Voice | Total brand mentions across answers | Your share of all mentions |
| Brands Distribution | Mentions grouped by leading brands vs. others | Where the conversation concentrates |
Step 4: Read the top cited sources
Scroll to the Top Sources block. It lists the Top 10 Cited Domains behind the answers, each with the percentage of citations it represents, and toggles between Domains and URLs views.
The Top Domains Trend and Top URL Trend charts show how reliance on each source shifts across the period.
The sources block reveals which websites AI assistants draw on when they answer this topic. Here combak.co leads at 14%, followed by certideal.com at 9% and recommerce.com at 8% — these are the pages shaping the answers your brand competes inside.
💡 Tip: Switch from Domains to URLs to see the exact pages cited, such as buying guides and comparison articles. These are concrete targets for outreach or content.
Key takeaways
- The Visibility Score is presence: the percentage of analyzed answers your brand appears in for one topic.
- Score Evolution shows direction: read the slope of your line against competitors over the selected window.
- Share of Voice shows ownership: total mentions as a percentage, which can differ from the score.
- Top Sources explain the numbers: the domains and URLs AI assistants cite are concrete targets to influence.
- The report reads answers, it does not create them: improving these figures happens through your content and outreach.